The Busiest & Biggest Airports in the US [Updated for 2024]
Last update: March 2024. Some figures are not available for some airports at this time. Private Jet Charter airports are included at the bottom of this page.
Table of Contents
What are the top 10 busiest airports in America?
What are the top 5 busiest airports in the US?
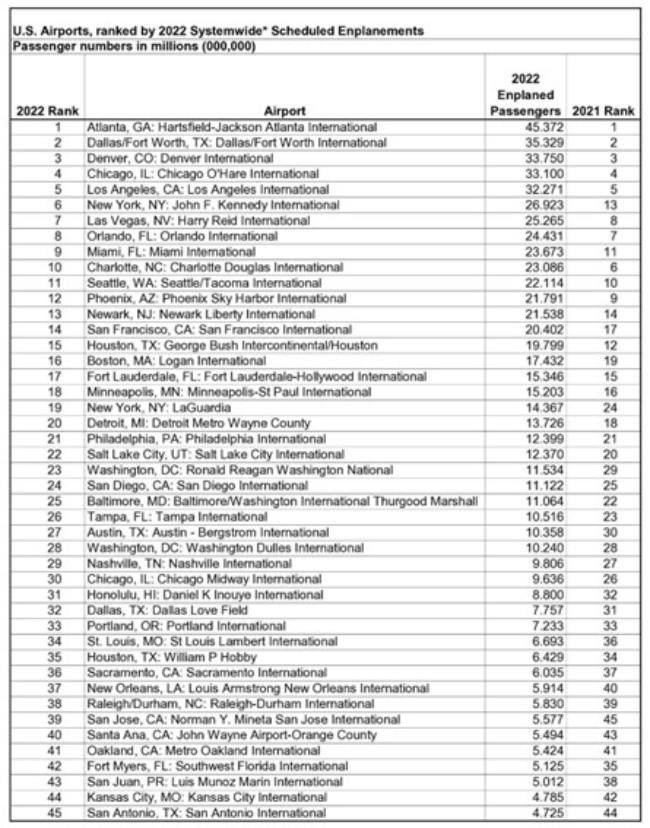
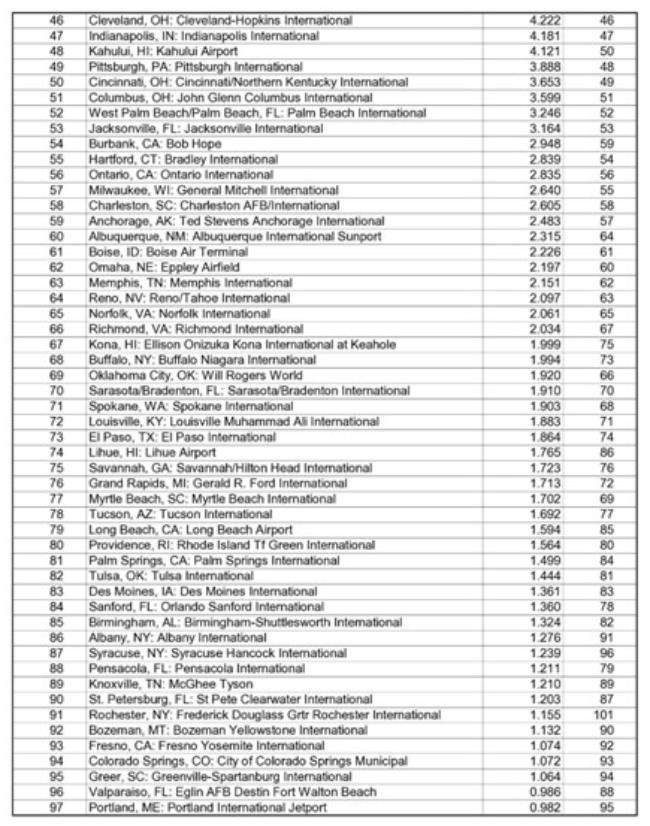
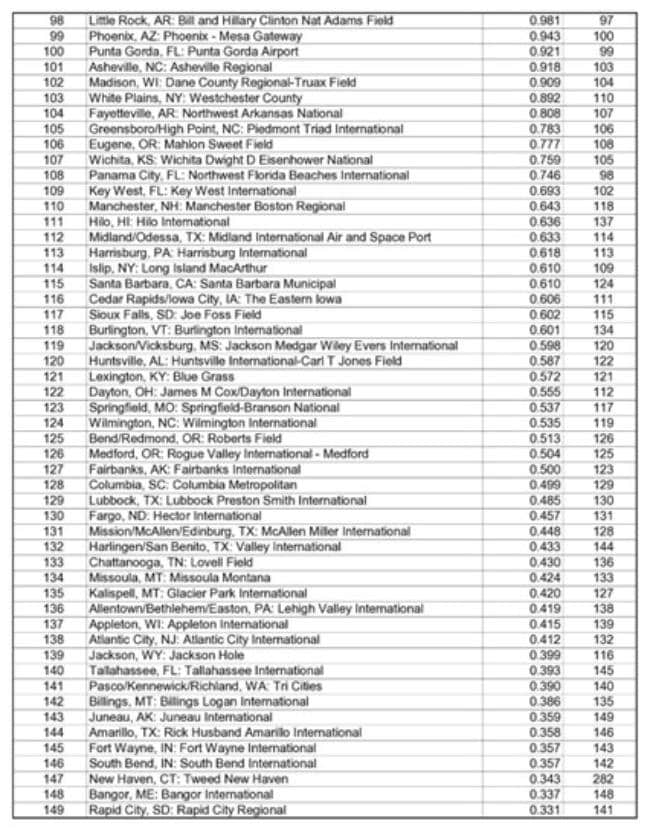
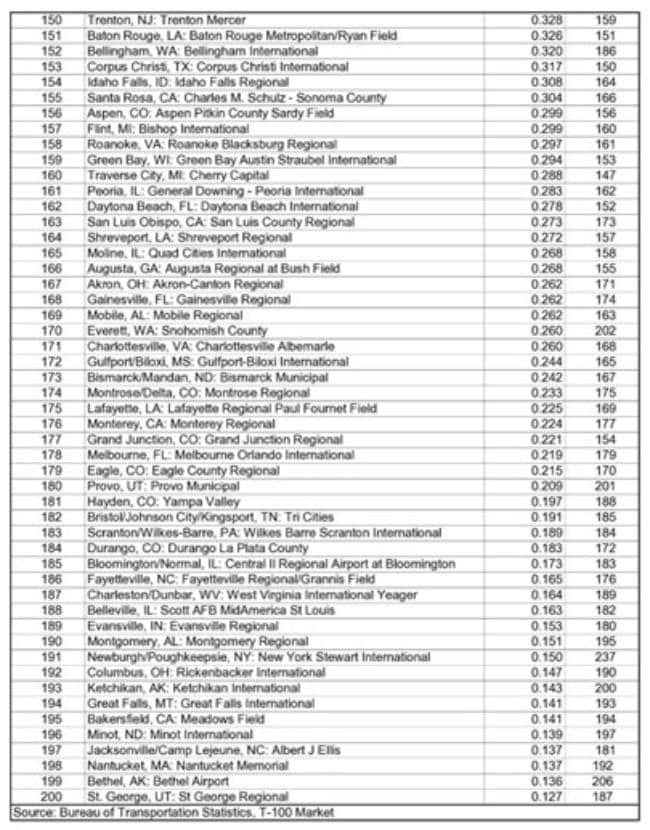
What are the top 200 busiest airports in the USA?
What are the top 20 busiest airports in the United States?
What are the top 10 biggest airports in the US?
- Busiest: Atlanta Hartsfield-Jackson (ATL) with 45.4 million passengers
- Top 5: ATL, Dallas/Fort Worth, Denver, Chicago O’Hare, Los Angeles
- Largest: Denver, Dallas/Fort Worth, Orlando, Washington Dulles
- Best (by traveler survey): Manchester-Boston Regional Airport
America has some of the biggest airports in the world with an incredible amount of foot and flight traffic. But which airports are the busiest?
Here’s a mega-list of the 200 busiest airports in the US, ordered from most busy to least busy.
2022 monthly figures are based on the airport’s own reporting of their traffic numbers. Yearly figures are based on the most recent enplaned passenger figures from the US Dept of Transportation.
What Are the Top 10 Busiest Airports in America?
- Atlanta International Airport – 45.4 million passengers
- Dallas/Fort Worth International Airport – 35.3 million passengers
- Denver International Airport – 33.7 million passengers
- Chicago O’Hare International Airport – 33.1 million passengers
- Los Angeles International Airport – 32.3 million passengers
- New York JFK International Airport – 26.9 million passengers
- Las Vegas International Airport – 25.3 million passengers
- Orlando International Airport – 24.4 million passengers
- Miami International Airport – 23.7 million passengers
- Charlotte Douglas International Airport – 23.1 million passengers
What Are the Top 20 Busiest Airports in the United States?
- Atlanta International Airport – 45.4 million passengers
- Dallas/Fort Worth International Airport – 35.3 million passengers
- Denver International Airport – 33.7 million passengers
- Chicago O’Hare International Airport – 33.1 million passengers
- Los Angeles International Airport – 32.3 million passengers
- New York JFK International Airport – 26.9 million passengers
- Las Vegas International Airport – 25.3 million passengers
- Orlando International Airport – 24.4 million passengers
- Miami International Airport – 23.7 million passengers
- Charlotte Douglas International Airport – 23.1 million passengers
- Seattle International Airport – 22.1 million passengers
- Phoenix International Airport – 21.8 million passengers
- Newark International Airport – 21.5 million passengers
- San Francisco International Airport – 20.4 million passengers
- Houston Bush International Airport – 19.8 million passengers
- Boston Logan International Airport – 17.4 million passengers
- Fort Lauderdale-Hollywood International Airport – 15.3 million passengers
- Minneapolis International Airport – 15.2 million passengers
- New York LaGuardia Airport – 14.4 million passengers
- Detroit Metro – 13.7 million passengers
What Are the Top 200 Busiest Airports in the USA?
Which Airport is the Busiest in the United States?
Hartsfield-Jackson Atlanta International Airport is the busiest airport in the US. It handles 45.4 million passengers on 337,023 flights per year. That’s almost 1,000 flights per day. This makes Atlanta one of the busiest airports in the world.
Atlanta was also the busiest airport in the US in 2021, handling 36.7 million passengers.
Atlanta saw a 23.7% increase in passenger numbers between 2021 and 2022.
What Are the Top 5 Busiest Airports in the US?
- Atlanta International Airport – 45.4 million passengers
- Dallas/Fort Worth International Airport – 35.3 million passengers
- Denver International Airport – 33.7 million passengers
- Chicago O’Hare International Airport – 33.1 million passengers
- Los Angeles International Airport – 32.3 million passengers
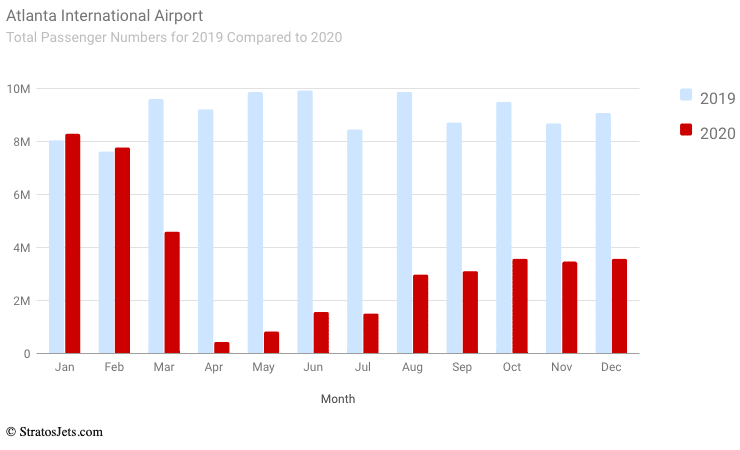
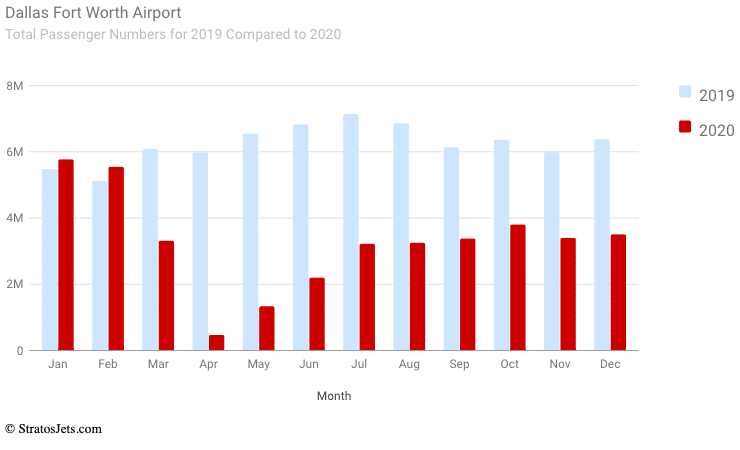
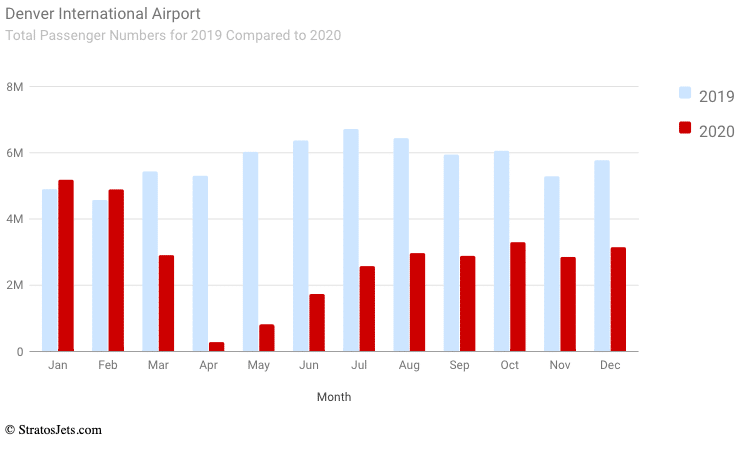
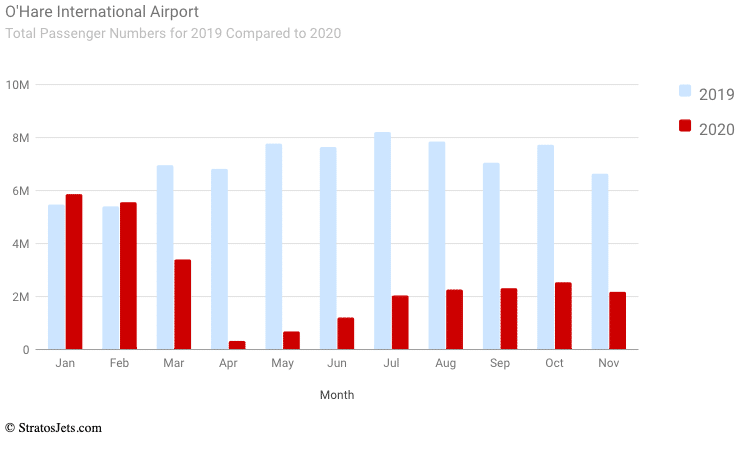
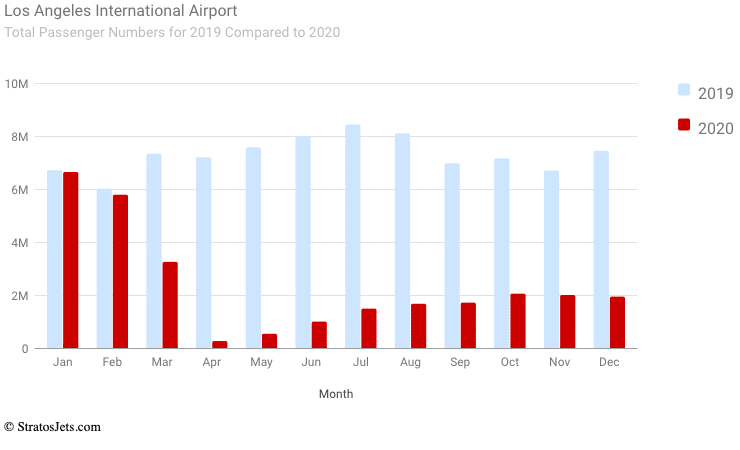
Here is a further breakdown of the top 5 busiest airports in the US. See below the comparison between 2021 and 2022 data. As you can see, there has been a gradual increase since the COVID-19 travel restrictions.
Atlanta International Airport – ATL (Total passengers)
Dallas/Fort Worth International Airport – DFW (Total passengers)
Denver International Airport – DEN (Total passengers)
O’Hare International Airport – ORD (Total passengers)
Los Angeles International Airport – LAX (Total passengers)
Top 10 Biggest Airports in the US
We’ve examined in great detail the busiest airports in the US. But which are the largest airports in the US? Atlanta may be the busiest, but it’s not the largest.
So, for those curious about the biggest US airports, here’s the top 10:
- Denver International Airport, Colorado (DEN)
- Dallas/Fort Worth International Airport, Texas (DFW)
- Orlando International Airport, Florida (MCO)
- Washington (Dulles) International Airport, Washington, D.C. (IAD)
- George Bush Intercontinental Airport, Houston, TX (IAH)
- Salt Lake City International Airport, Utah (SLC)
- O’Hare International Airport, Chicago (ORD)
- San Francisco International Airport, California (SFO)
- John F Kennedy Airport, New York City (JFK)
- Detroit Metropolitan Airport, Michigan (DTW)
The largest US airports cover impressive stretches of land. They feature many runways and terminals to handle the high volume of air traffic. Denver and Orlando airports, for example, serve millions of travelers each year. They still have plenty of room for operations and future expansions.
What is the Best Airport in the US?
We’ve looked at the busiest airports in the US and also some of the largest. However, which is the best airport in the country?
Travel and Leisure conducted a survey asking readers to rate airports based on several factors. Some of these included check-in/security, restaurants/bars, access, shopping, and of course, design.
The winner was Manchester-Boston Regional Airport in New Hampshire, which ranked as the best airport overall.
Manchester-Boston Regional Airport has become a top choice for travelers because of its cleanliness, efficiency, and easy accessibility. It serves around 1.7 million passengers each year. It offers a wide range of flights from different airlines to give passengers plenty of options.
Voters also appreciated the knowledgeable and dedicated staff who genuinely love what they do. The airport’s security measures are highly praised. Travelers describe the process as seamless and the TSA agents as highly professional.
We hope you enjoyed learning about the top US busiest airports!
Founded in 2006, Stratos Jet Charters, Inc. prides itself on delivering exceptional customer experience. The best part is that as an agent for air charter, we don’t own or operate aircraft. This allows us to recommend the most suitable aircraft and carrier that best meets your specific needs. Book a charter flight!
Fair Use Statement
We grant permission to use the images and data found on this page freely. When doing so, we ask that you kindly attribute the creators. You can do this by linking to this page so your readers can learn more about the project and its methodology.
Empty Leg Flights
- Mid
- Citation XLS
HKY (HICKORY)
HKY Airport
APF (NAPLES)
APF Airport
- Heavy
- Challenger 601
ORL (ORLANDO)
ORL Airport
TEB (TETERBORO)
TEB Airport
- Heavy
- Challenger 601
ORL (ORLANDO)
ORL Airport
TEB (TETERBORO)
TEB Airport
- Light
- Citation CJ4
BOS (BOSTON)
BOS Airport
TEB (TETERBORO)
TEB Airport
- Mid
- Hawker 900XP
ACK (NANTUCKET)
ACK Airport
FOK (WESTHAMPTON BEACH)
FOK Airport
Are you ready to book your Atlanta and Miami charter flight yet?
Our friendly, expert air charter agents are here to answer questions or start your quote today. Don`t wait, call now and we'll get you on your way to your destination!
Call 888-593-9066